In a recent study, HomeJab found a significant difference in the amount of marketing dollars agents spent on listings before and after COVID. The study looked at more than 43,000 professional real estate photography assignments over the last five years.
One of the biggest takeaways from HomeJab’s research was that agents in “blue states” (e.g., California, Illinois, Massachusetts, and New York) spent more on real estate marketing in COVID’s wake than those in “red states” (e.g., North Carolina, South Carolina, and Texas).
Let’s take a closer look at the data to see how these two groups compare.
Blue vs. Red State Real Estate Marketing Spend
At the state level, the numbers highlighted a significant increase in spending habits among agents in prominent blue states.
Here’s a look at the data from highest to lowest amount:
Blue State + % Change in Spend
New York +27.9%
Massachusetts +18.5%
California +9.7%
Illinois +7.7%
Except for Florida — a battleground state that flipped from blue to red in the 2016 general election — many other red states saw a decrease in agent marketing spend, with some of the following regions experiencing the most significant drops:
Red State + % Change in Spend
South Carolina -23.4%
North Carolina -16.5%
Texas -0.1%
(Florida saw a modest increase of 6.3%).
Why Did Blue States Spend More on Real Estate Marketing Post-COVID?
The data suggests one primary reason: During the early days and weeks of the global pandemic, blue states were among the first to ban open houses.
California, the most populous state in the nation, was the first blue state to issue a mandatory stay-at-home order back in March 2020, followed by Illinois.
By contrast, Texas and the Carolinas were among the last. Gov. Greg Abbott of Texas even avoided using the terms “shelter-in-place” or “stay-at-home” when he signed the executive order on March 31, 2020.
As a result, many agents in blue states turned to innovative strategies like video and 3D tours to help remote buyers feel like they were inside the homes they were interested in purchasing.
And because lockdowns tended to last shorter in red states, buyers and sellers in blue states relied on these virtual services for a longer period, which likely contributed to the higher marketing spend.
What Virtual Services Did Agents Use the Most After COVID?
HomeJab’s industry research looked at the pandemic’s effect on the types of virtual services agents spent the most on.
Not surprisingly, video content and 3D virtual tours ordered by agents increased dramatically from 37% to 53% of all photoshoot requests nationwide. In 2021, as open houses resumed, this increase fell somewhat to 48% but remained above 2019’s pre-pandemic levels.
In light of this, we anticipate that real estate agents across the country will continue to include video and 3D tours as part of their go-to photo packages on all listings, especially now that their reference levels have changed.
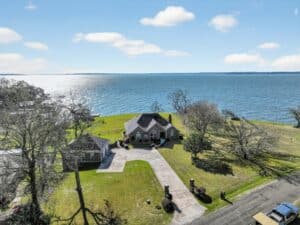
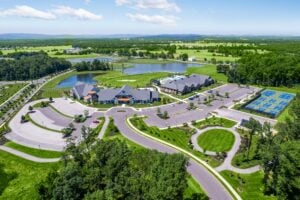
We also expect that real estate aerial photography will continue its upward trend, as this unique service helps agents show potential buyers a property’s full scope and size from a bird’s eye view.
After all, some buyers aren’t ready to attend a crowded open house just yet, which makes these marketing tools even more valuable for agents going forward.
Regional Differences in Post-COVID Real Estate Marketing Spend
Now that we’ve looked at how blue vs. red state agents have responded to COVID, let’s explore how different regions of the country have been affected.
HomeJab’s data showed that agents in the West, Northeast, and Midwest were spending more on real estate photography post-pandemic than their counterparts in the Southwest and Southeast regions of the U.S.
Specifically, the numbers showed:
- West: Up nearly nine percent (8.7%)
- Northeast: +7.5%
- Midwest: +5.6%
- Southwest: -0.6%
- *Southeast: +2.8%
* Agents in the Southeast spent modestly less for real estate listing photography services since COVID started.
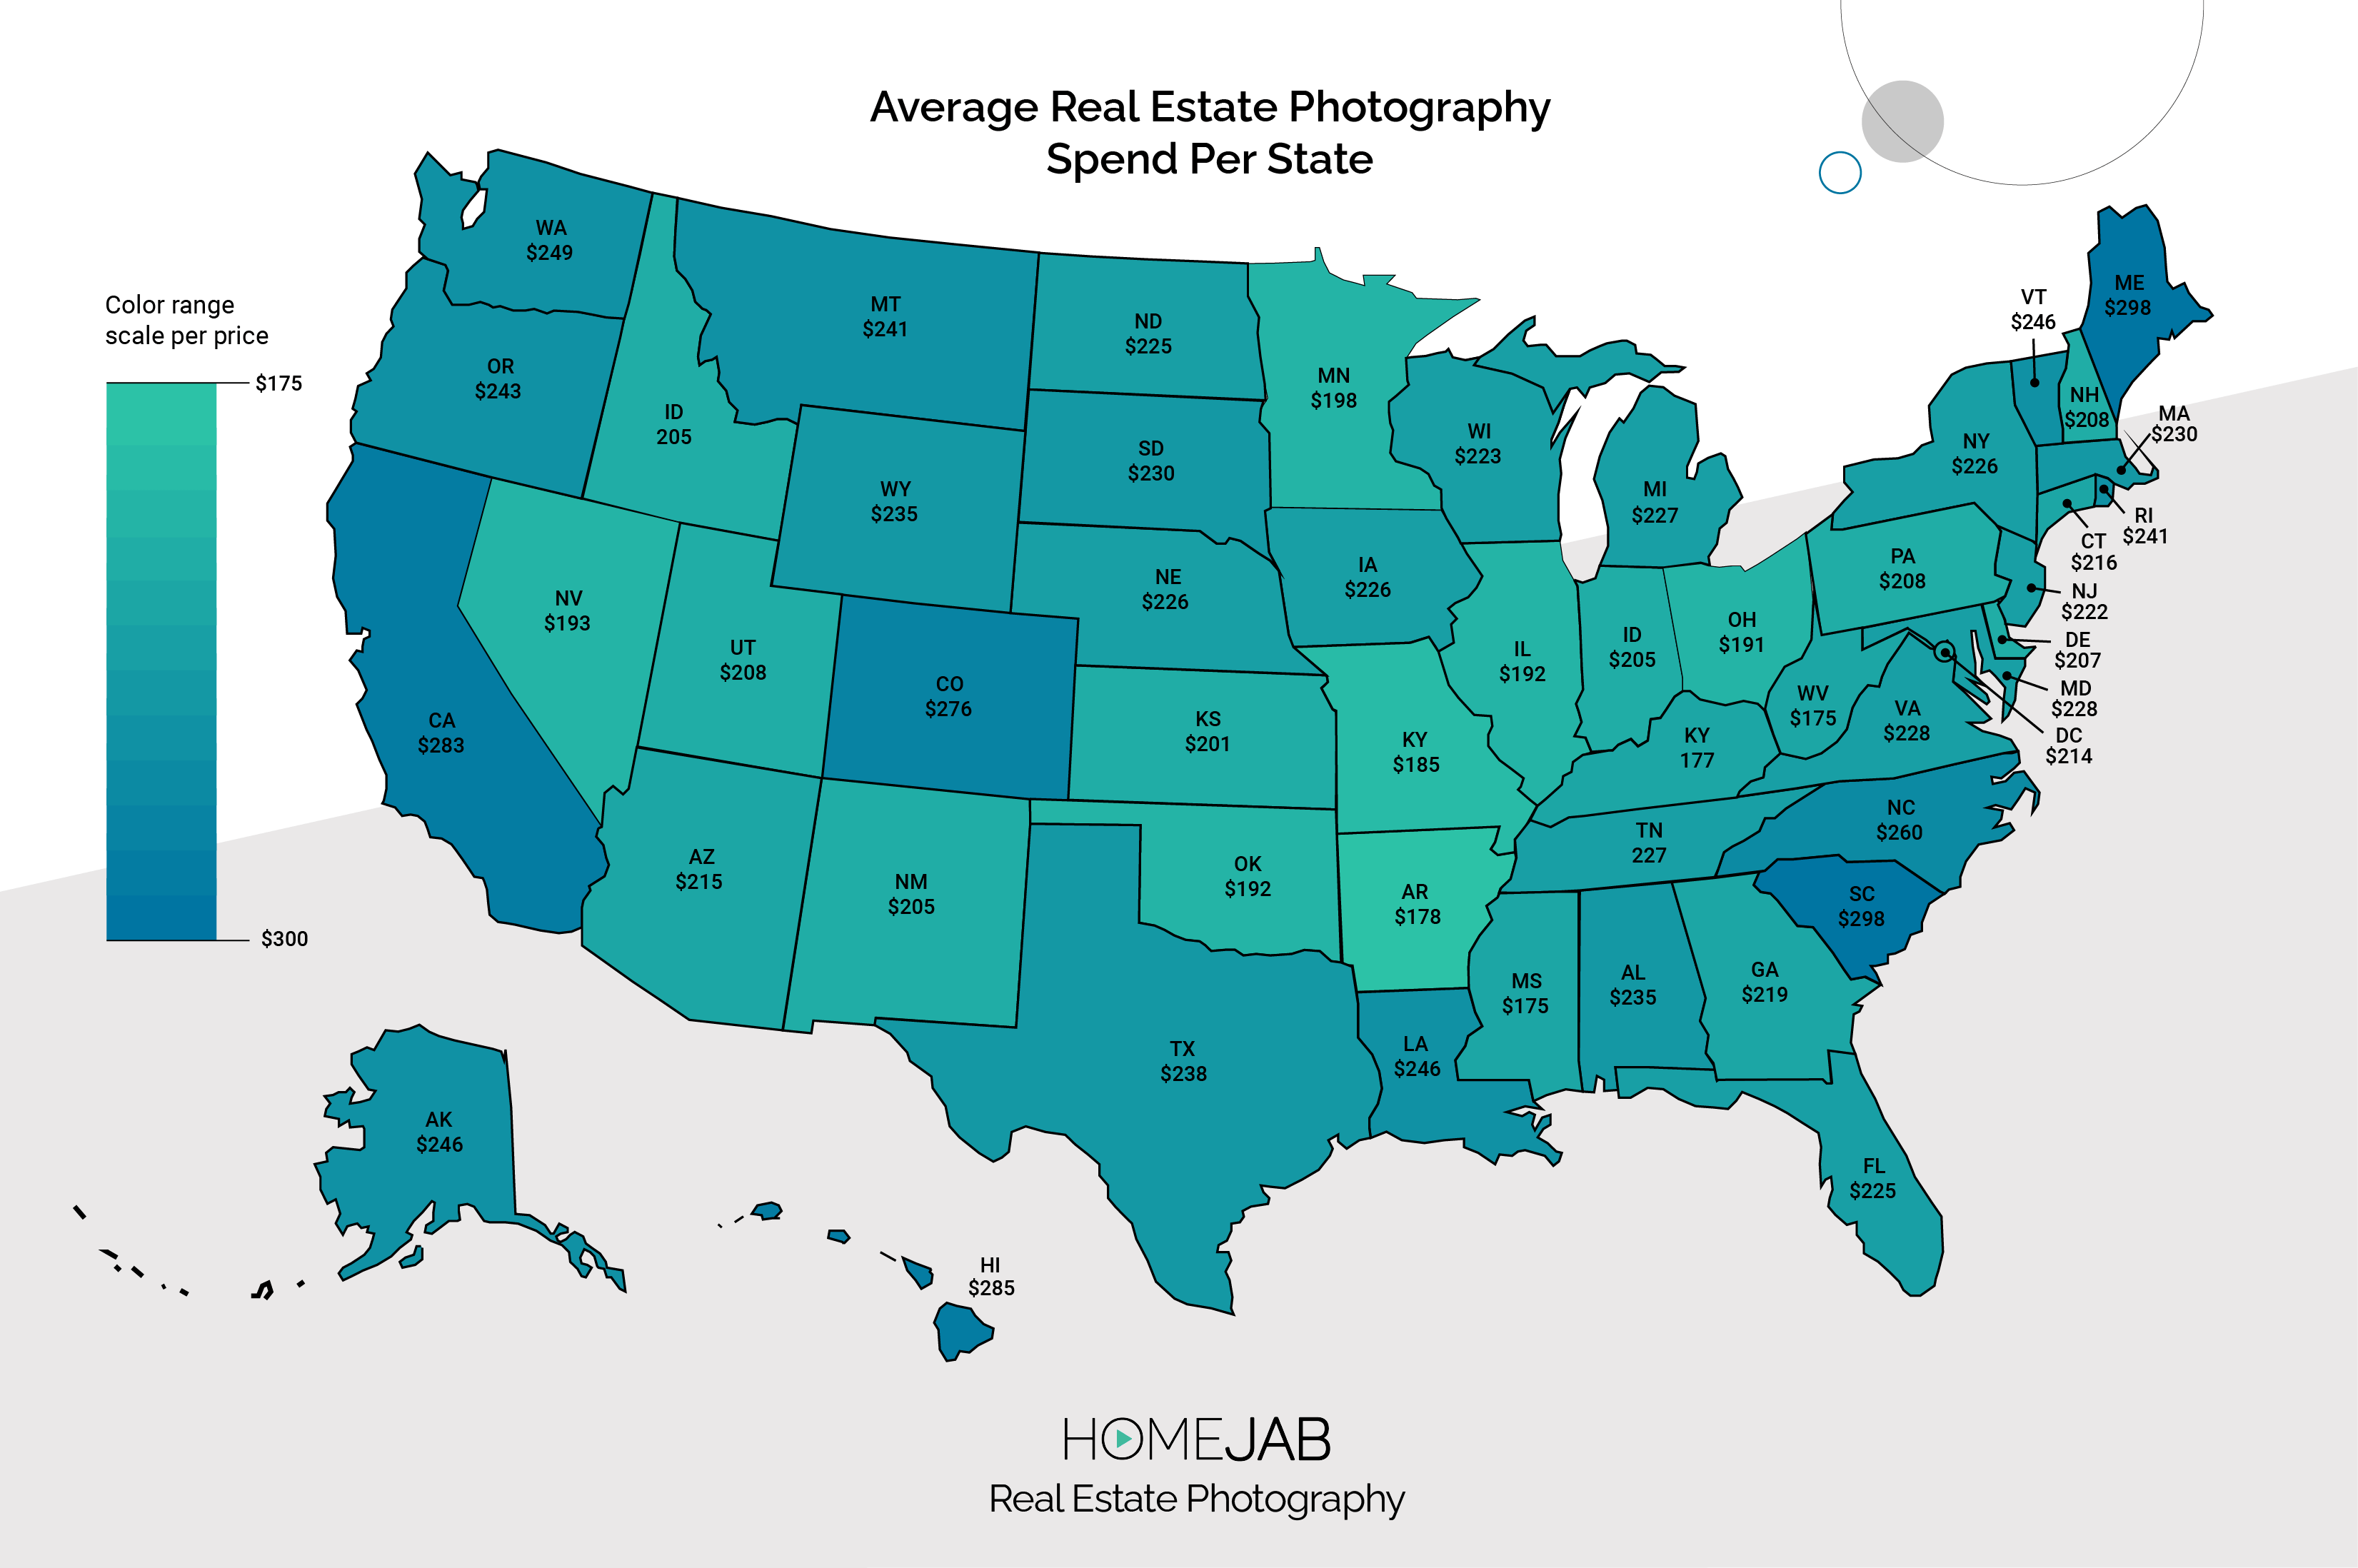
Furthermore, HomeJab discovered that the average real estate listing photography order went up 5.9% from the pre-pandemic average of $216.50. After COVID, that average order price rose to $229.
But this also varied by region. In the West, for instance, real estate agents spent the most on real estate listing photography services, averaging $279 per order.
Midwest agents spent the least at $200 per order, nearly 40% less than agents in the West.
Northeast real estate agents spent the second least amount, averaging $225 per order.
And last but not least, Southeast and Southwest real estate agents’ average spend on real estate listing photography services averaged $229 and $235 respectively.
The Bottom Line
In many of the hottest markets during COVID, real estate agents got creative with their virtual marketing efforts to attract buyers and keep existing ones engaged. Sellers also benefitted from these services, as they allowed agents to show their homes in the best possible light without having to host open houses in person.
More importantly, HomeJab’s research showed that during a time in which home sales struck a frantic pace — and the average number of multiple offers hit a new high — agents recognized the power and client value of utilizing video, 3D tours, and other virtual services in their real estate marketing.
Although things are slowly returning to “normal,” we believe that agents who use professional real estate photography services in the digital era will have a significant competitive edge over those who don’t, in part due to the post-COVID trends we discovered in our research.
If you’re a real estate agent or professional real estate photographer and would like to learn more about HomeJab, visit our website.

